SMLF ETF: A Small Cap ETF Beating The Benchmark, But Lagging A Few Peers

[ad_1]
syahrir maulana
SMLF strategy
iShares U.S. Small-Cap Equity Factor ETF (NYSEARCA:SMLF) started investing operations on 4/28/2015 and tracks the STOXX U.S. Small-Cap Equity Factor Index. It has 863 holdings, an expense ratio of 0.15% and a 30-day SEC yield of 1.54%.
As described in the prospectus by iShares, constituents are
“selected and weighted using an optimization process designed to maximize exposure to four target factors: momentum, quality, value, and low volatility.“
The score is calculated for each of the 4 factors:
- The momentum score is based on price momentum, earnings momentum and earnings announcement drift.
- The quality score is based on gross profitability, share dilution, accruals, changes in net operating assets, carbon emissions intensity and greenhouse gas reduction targets.
- The value score is based on book value-to-price ratio, dividend yield, earnings yield, cash flow yield.
- The volatility score is based on prior 12 month volatility.
Moreover, some constraints are enforced to avoid excessive concentration in the top holdings and sectors. The underlying index is rebalanced quarterly. The portfolio turnover rate in the most recent fiscal year was 108%. This article will use as a benchmark the Russell 2000 index, represented by iShares Russell 2000 ETF (IWM).
SMLF portfolio
The top 3 sectors are industrials (19.3% of asset value), financials (15.8%) and consumer discretionary (15.3%). They are followed by technology (13.7%) and healthcare (11.1%). Other sectors are below 7%. The sector breakdown is not much different from the Russell 2000. Compared to the small cap benchmark, SMLF significantly overweights consumer discretionary and underweights mostly healthcare.
SMLF Sector breakdown (chart: author; data: iShares)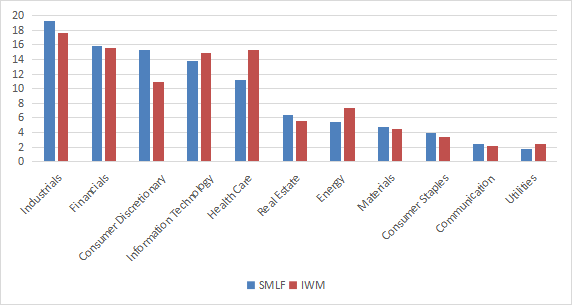
The top 10 equity holdings, listed below with valuation ratios, represent only 6.2% of asset value, and the heaviest position weighs less than 1%. Therefore, the fund is well-diversified across holdings and risks related to individual companies are very low.
|
Ticker |
Name |
Weight (%) |
P/E TTM |
P/E fwd |
P/Sales TTM |
P/Book |
P/Net Free Cash Flow |
Yield% |
|
EMCOR Group, Inc. |
0.76 |
26.12 |
24.63 |
1.31 |
6.67 |
20.89 |
0.21 |
|
|
Deckers Outdoor Corp. |
0.72 |
33.17 |
34.11 |
5.77 |
11.32 |
23.29 |
0 |
|
|
Williams-Sonoma, Inc. |
0.67 |
21.45 |
20.50 |
2.63 |
9.57 |
16.17 |
1.45 |
|
|
First Industrial Realty Trust, Inc. |
0.62 |
25.13 |
36.76 |
11.24 |
2.69 |
N/A |
2.84 |
|
|
Jabil, Inc. |
0.62 |
11.25 |
15.68 |
0.52 |
6.26 |
20.08 |
0.24 |
|
|
Evercore, Inc. |
0.58 |
30.26 |
17.86 |
3.20 |
4.95 |
26.18 |
1.58 |
|
|
Reliance, Inc. |
0.58 |
14.61 |
16.57 |
1.30 |
2.48 |
19.90 |
1.33 |
|
|
Dick’s Sporting Goods, Inc. |
0.56 |
18.18 |
16.70 |
1.42 |
7.03 |
25.90 |
1.99 |
|
|
Nutanix, Inc. |
0.56 |
N/A |
60.22 |
9.53 |
N/A |
48.93 |
0 |
|
|
Popular, Inc. |
0.55 |
11.32 |
9.99 |
1.60 |
1.20 |
18.69 |
2.91 |
Despite the valuation metrics embedded in the strategy, the usual valuation ratios are not much different from the benchmark. In fact, they are a bit more expensive, as reported in the next table. Nonetheless, earnings growth (which is a component of the momentum factor) is materially higher.
|
SMLF |
IWM |
|
|
Price/Earnings TTM |
15.53 |
15.2 |
|
Price/Book |
2.2 |
1.95 |
|
Price/Sales |
1.26 |
1.22 |
|
Price/Cash Flow |
9.37 |
8.94 |
|
Earnings growth |
25.64% |
19.85% |
Source: Fidelity.
Performance
Since 5/5/2015, SMLF has outperformed the Russell 2000 by 2.6% in annualized return, and shows a slightly lower volatility (measured as standard deviation of monthly returns in the table below). Maximum drawdowns are similar, though.
|
Total Return |
Annual Return |
Drawdown |
Sharpe ratio |
Volatility |
|
|
SMLF |
137.54% |
10.22% |
-41.89% |
0.49 |
19.69% |
|
IWM |
91.46% |
7.58% |
-41.13% |
0.36 |
21.05% |
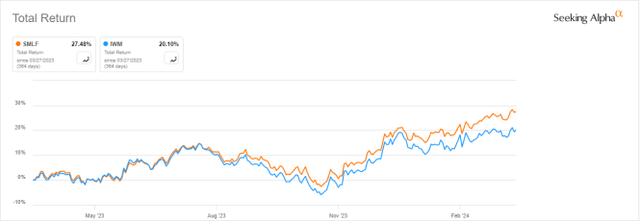
SMLF beats the benchmark by more than 7% over the last 12 months:
Competitors
The next table compares characteristics of SMLF and 5 factor-based small-cap ETFs implementing various strategies:
- Vanguard Small-Cap Value ETF (VBR)
- Avantis U.S. Small Cap Value ETF (AVUV)
- Pacer US Small Cap Cash Cows 100 ETF (CALF)
- Schwab Fundamental US Small Co. Index ETF (FNDA)
- Invesco S&P SmallCap Value with Momentum ETF (XSVM).
|
SMLF |
VBR |
AVUV |
CALF |
FNDA |
XSVM |
|
|
Inception |
4/28/2015 |
1/26/2004 |
9/24/2019 |
6/16/2017 |
8/15/2013 |
3/3/2005 |
|
Expense Ratio |
0.15% |
0.07% |
0.25% |
0.59% |
0.25% |
0.36% |
|
AUM |
$979.96M |
$52.94B |
$10.51B |
$9.40B |
$8.12B |
$764.54M |
|
Avg Daily Volume |
$3.70M |
$111.61M |
$65.69M |
$121.67M |
$19.29M |
$4.43M |
|
Holdings |
840 |
858 |
777 |
103 |
1013 |
119 |
|
Top 10 |
6.52% |
5.81% |
8.96% |
20.45% |
3.94% |
14.37% |
|
Turnover |
108.00% |
16.00% |
7.00% |
101.00% |
24.00% |
86.00% |
SMLF has the second lowest fee behind VBR, and it has the highest turnover. The next chart plots total returns, starting on 9/30/2019 to match all inception dates.
CALF is ahead of the competition, whereas SMLF is among three lagging funds.
SMLF vs. Competitors since 9/30/2019 ( Seeking Alpha)
Over the last 12 months, SMLF does not much better relative to peers, staying in the middle of the pack.
SMLF vs. Competitors, 12-month return (Seeking Alpha)
Takeaway
iShares U.S. Small-Cap Equity Factor ETF implements a sophisticated multi-factor strategy taking into account momentum, quality, value and volatility. SMLF is well-diversified across sectors and holdings. It has outperformed the small cap benchmark Russell 2000 since its inception. Nonetheless, it has lagged at least 3 factor-based small cap ETFs since 2019: CALF (focused on cash flow), XSVM (momentum-based) and AVUV (value and quality). SMLF was listed 9 years ago and its track record covers mostly a strong bull market: past performance might not be representative of its potential on the long term.
Editor’s Note: This article discusses one or more securities that do not trade on a major U.S. exchange. Please be aware of the risks associated with these stocks.
[ad_2]
Source link
